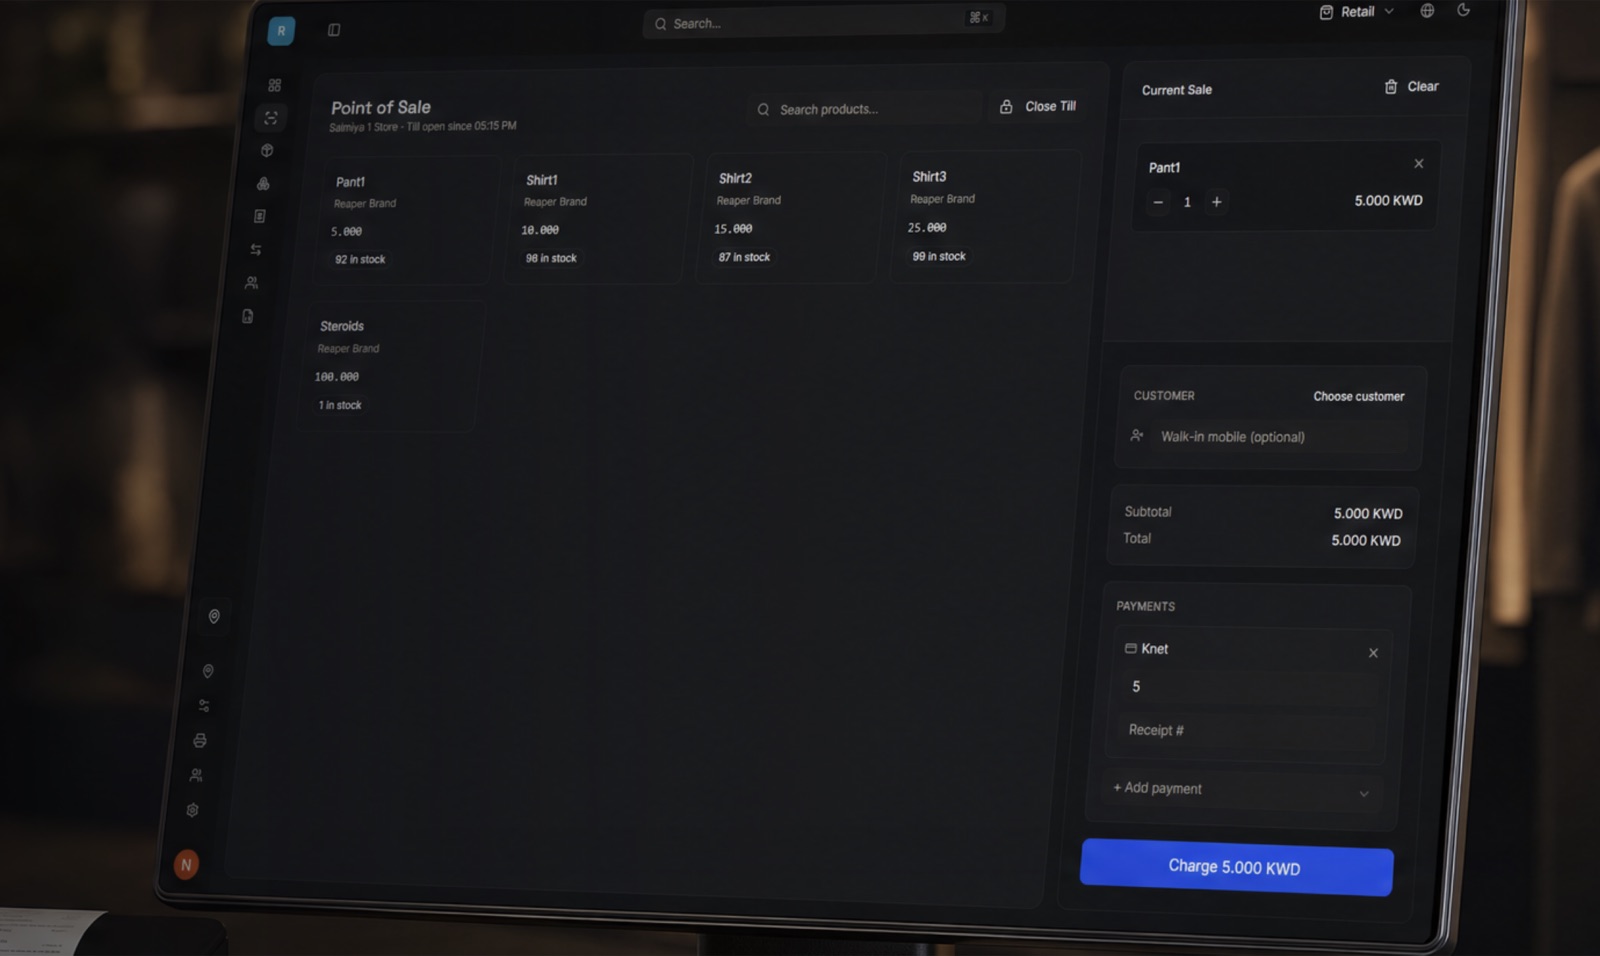
KPI dashboards
Revenue, real profit, top products and team performance, live.
Reporting, admin panels and KPI dashboards that turn day-to-day data into clear decisions.
Most owners and managers cannot see how the business is actually doing without someone building a spreadsheet first. We build dashboards and data tools that pull straight from your systems, so revenue, real profit, stock, staff and customer numbers are live and trustworthy.
Beyond dashboards, we build the admin panels and internal tools teams use every day, and reports that arrive on their own by email or WhatsApp. Numbers are defined once and calculated the same way everywhere, so every meeting starts from the same figures.
Revenue, real profit, top products and team performance, live.
Internal tools to manage customers, orders, content and approvals.
Daily and weekly reports delivered by email or WhatsApp.
Data pulled from your systems, cleaned and kept up to date.
A message when a number moves: low stock, a sales drop, a failed payment.
PDF, CSV and Excel exports for accountants and management.
We define the figures that matter and exactly how each is calculated.
Your systems are connected and the data cleaned and checked.
Dashboards and reports designed for the people who read them.
Access set up by role, with alerts and scheduled reports switched on.
Our engineers work across TypeScript, Python, C# / .NET, Rust, Swift and Kotlin, so we can build in the stack your team already uses.
Yes. Dashboards pull from the systems and spreadsheets you already use.
Spreadsheets go out of date and are calculated differently by different people. A dashboard stays live and uses one agreed definition for every number.
Access is set by role, so each person only sees what they should.
Tell us what you’re working on. We’ll turn it into a clear technical plan and a practical next step.